4.1 Create a simple counter design and simulation
0. Prerequisite
It is assumed that you already install the opensource design tools using docker.
1. Run the UNIC-CASS Docker image
Open a terminal and change the directory to the uniccass-design-tools as s described in (Installing design tools using docker)(/training/2.2-AMS-docker-remote.html), and run make start:
$ cd $HOME/projects/uniccass-design-tools
$ make start
2. Writing the Verilog files
We first need to write some verilog files: a digital circuit and its testbench.
Create counter.v and counter_tb.v by running the following command in the uniccas-design-tools docker shell:
wget https://unic-cass.github.io/training/files/counter.v
wget https://unic-cass.github.io/training/files/counter_tb.v
module counter(
    input clk, nrst,
    output reg [3:0] ctr_out
);

reg [3:0] ctr;

always@(posedge clk) begin
    if (!nrst)
        ctr <= 0;
    else
        ctr <= ctr + 4'b1;
end

always@(*)
    ctr_out <= ctr;

endmodule
module counter_tb;

reg nrst,clk;
wire [3:0] c;

counter UUT(.ctr_out(c),.clk(clk),.nrst(nrst));

always begin
    #10
    clk = ~clk;
    $display("Counter value:%b @ time %f",c,$time);
end

initial begin
$dumpfile("test.vcd");
$dumpvars(0,counter_tb);

// we have to start somewhere
clk = 0;
nrst = 0;

#15
nrst = 1;

#100

$finish;
end

endmodule
3. Behavioral Simulation
Next, we can run iverilog to compile the verilog code into something readable by the vvp simulator. In general, the iverilog command can be run in the following syntax:
iverilog -o <output_file_name> <design_file_1> <design_file_2> ... <design_file_n>
The following command is used to compile the counter example and its testbench into the executable file counter_tb.
iverilog -o counter_tb counter_tb.v counter.v
Finally, we can pass the iverilog output to the vvp simulator to produce the output waveforms in .vcd format. In general, the vvp command can be run with the following syntax:
vvp counter_tb # or ./counter_tb
designer ~
$ iverilog -o counter_tb counter_tb.v counter.v
designer ~
$ vvp counter_tb
VCD info: dumpfile test.vcd opened for output.
Counter value:xxxx @ time 10.000000
Counter value:0000 @ time 20.000000
Counter value:0000 @ time 30.000000
Counter value:0001 @ time 40.000000
Counter value:0001 @ time 50.000000
Counter value:0010 @ time 60.000000
Counter value:0010 @ time 70.000000
Counter value:0011 @ time 80.000000
Counter value:0011 @ time 90.000000
Counter value:0100 @ time 100.000000
Counter value:0100 @ time 110.000000
counter_tb.v:27: $finish called at 115 (1s)
designer ~
You will see that the $display directive in verilog testbenches are passed to the output during the vvp command call.
4. View the simulation waveform
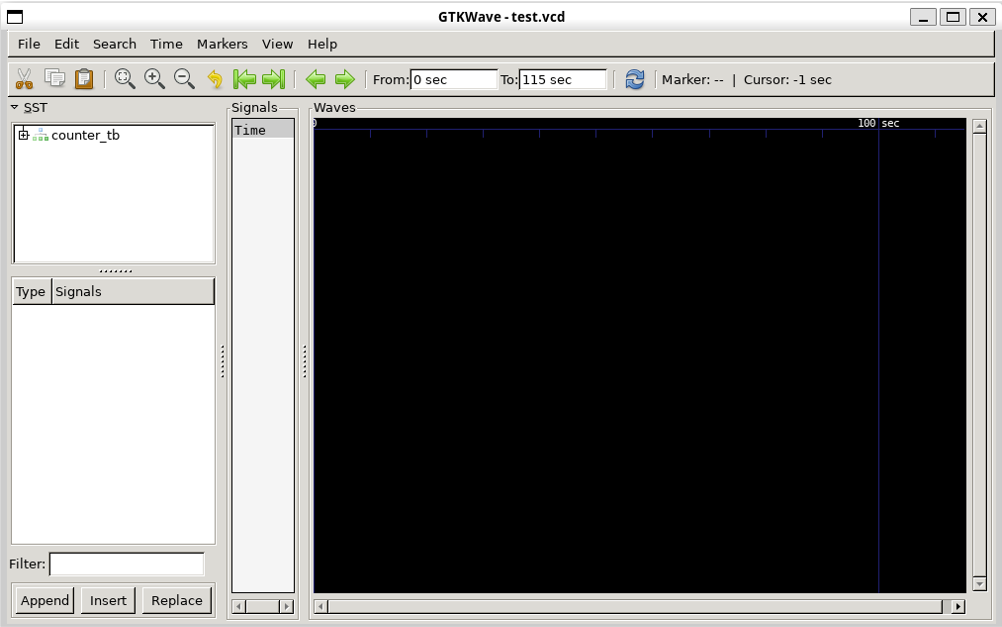
The simulation waveform was dumped into test.vcd file. This file can be viewed by using GTKwave. Open GTKWave to view the waveform by this command:
gtkwave test.vcd
A new window will pop up with the data from the simulation.
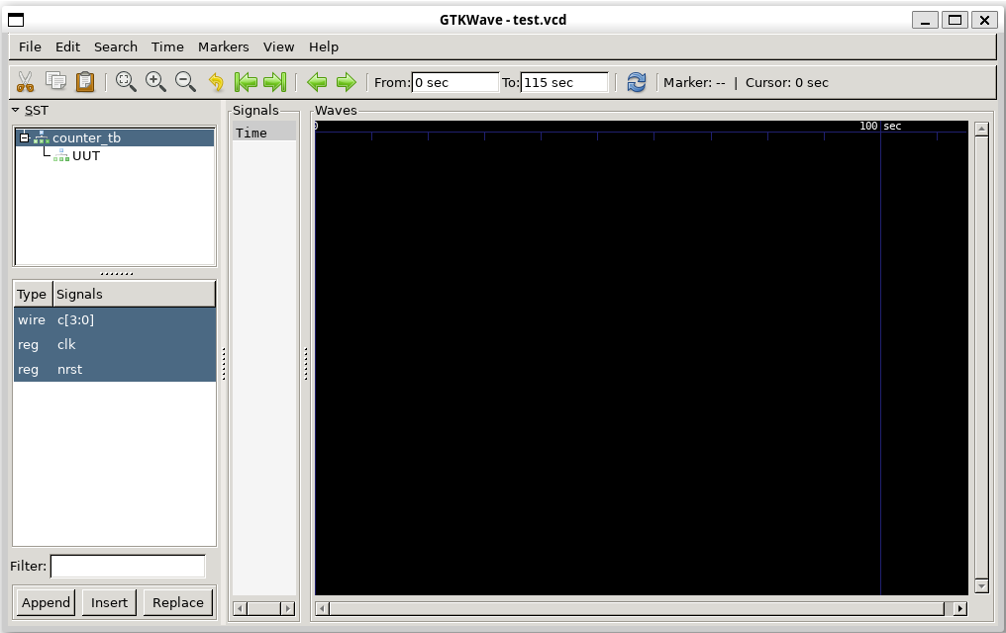
5. Add the signals to the waveform viewer
- Click on
counter_tbon the left pannel. You will see the list of signal on the second pannel on the left. - Select all of them as in the figure.
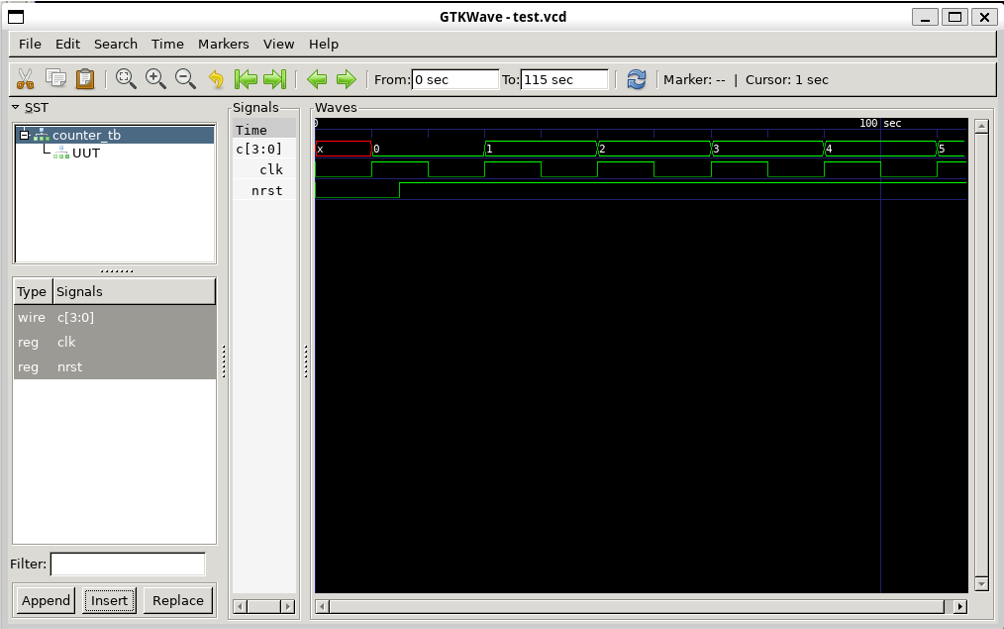
- Click on
Insertbutton at the end of the left pannel to insert the signal into the waveform.
6. Repeat the above procedure to add the signals inside the counter design into the waveform viwer
- Click on
UUTon the left pannel. You will see the list of signal on the second pannel on the left. - Select all of them as in the figure.
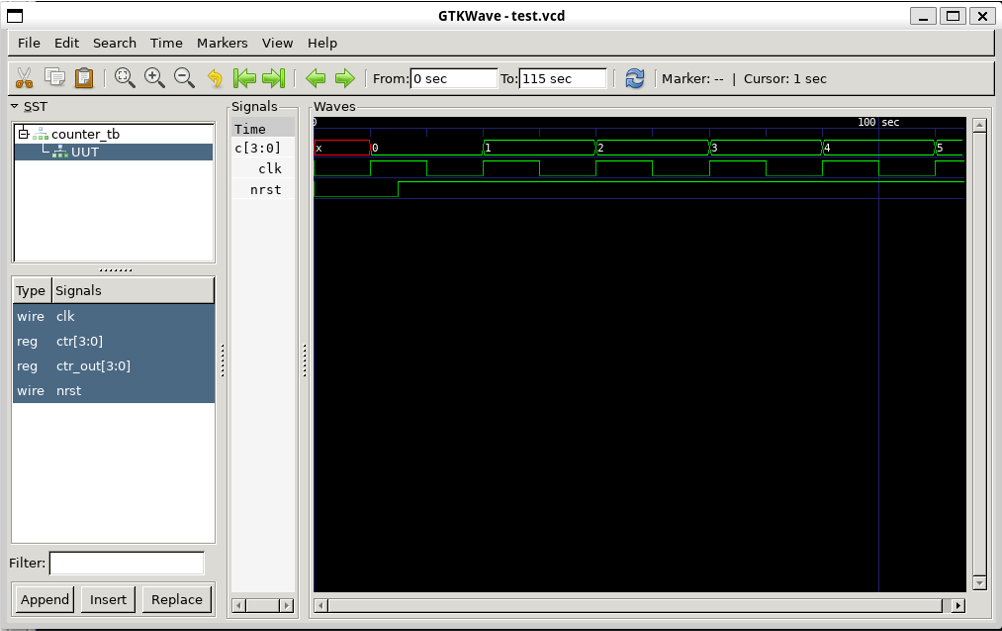
- Click on
Insertbutton at the end of the left pannel to insert the signal into the waveform.
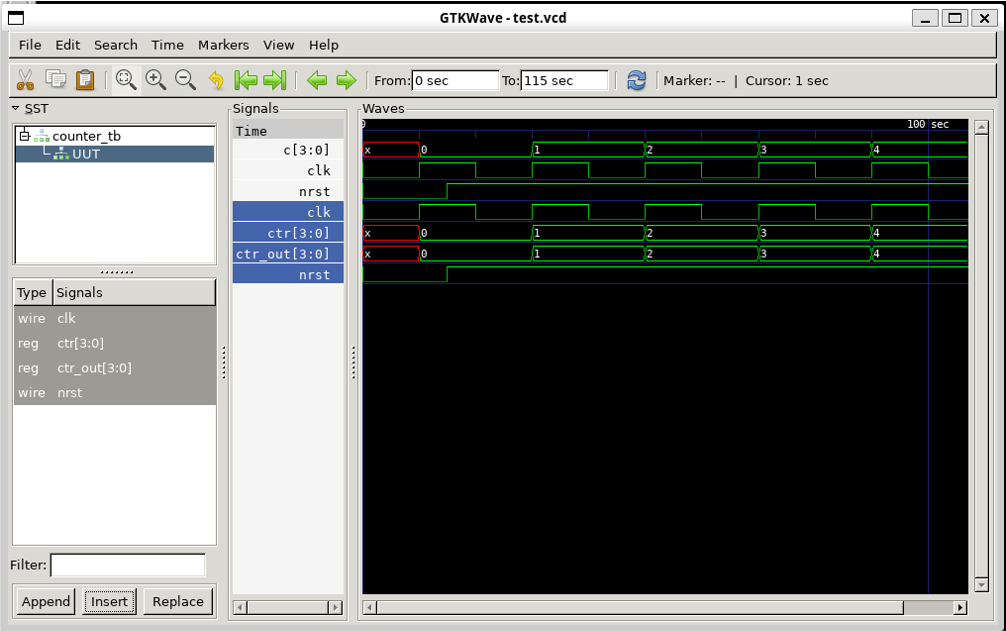
7. The design should work as expected
You have to check if the design works as expected. Otherwise, you will have to debug and fix it.